
Photo Credit: Ksenia Cherneya
E-Commerce is Growth Industry Once Again
Shopify President Harley Finkelstein shared some incredible high-level stats on sales performance over Black Friday and Cyber Monday weekend. 9.3 billion dollars in global sales took place on the platform over the shopping holiday, more than three times the $2.9 billion spent on the platform for Black Friday in 2019. More than 55,000 merchants had their highest-selling day on Shopify ever, across an estimated 61 million customers.

With numbers like these, it’s clear that e-commerce, despite a hesitant global economic outlook, continues to grow at a steady clip. And right now is certainly the season to celebrate. The majority of DTC brands take in a disproportionate share of annual revenue in the final quarter of the year - thanks in large part to events like Black Friday, Cyber Monday, and holiday gift shopping.
Gone are the days when consumers scrabbled to storm the entrances of big box stores like Target and Walmart at the crack of dawn to harvest the latest trendy toy or gadget at a hefty discount.
But as Shopify’s data shows, that doesn’t mean we’re not spending!
Instead, more and more shoppers are clicking add to cart online from Black Friday through Cyber Week and resting comfortably on the couch waiting for UPS to deliver in December. At Next Big Shop we are now tracking individual DTC brands that have reached more than $1Bn in projected annual revenue (hint hint, we’ll tell you who it is in this article), and others headed in the same direction.
Counting our Chickens
While top-line revenue numbers like the above are encouraging for the industry, to get a better sense of what the e-commerce universe looks like at the moment, we wanted to take a closer look under the hood. In this extended edition of our ShopScoop series, we’ll determine how sales performance breaks down across categories for Black Friday and Cyber Week (BFCM), the top brands across these categories, and just what this all tells us about how consumer behavior has, and is, shifting. In other words, not just how much we’re spending, but what exactly we’re spending it on.
We’re tracking 15 categories from apparel to food to the latest in tech. Looking at the top 1000 products sold in each category over the shopping holiday, we’ve uncovered some valuable insights into the state of e-commerce, including which categories are leading the charge, how average pricing for a category impacts overall market share, which brands are attracting online shoppers in droves and why.
So Who is Selling the Most?
When it comes to the total number of products sold by category, there are four that perform above average: Apparel, Beauty, Home, and Accessories. (In this case, the average is roughly 934,000 units.)
Apparel in particular stands out as a category to watch, with close to double the number of units sold online than for runner-up: Beauty.

While Home remains a large category in e-commerce, the pandemic era had us investing much of our spare change into upgrading home offices and attempting to improve our day-to-day stuck inside with new furnishings, fixtures, and fancy landscaping. Now, it seems consumers are shifting more and more of their spend to fresh kicks, fancy pants, and investing in high-end natural beauty products promoted by Gen Z influencers and middle-aged celebrities alike.
Show Me The Money!
But in assessing performance more factors come into play than just the number of products you sell. The actual price of goods sold has a big impact on a category’s overall share of the market, at least if we are measuring this in terms of revenue (which I believe we are…🤔). Comparing the number of products sold to dollars earned lets us identify market opportunities like categories that may be selling in large quantities, but for whatever reason aren’t capturing quite as much revenue.

This view of the data reveals that while brands in the Beauty category sold 1.5x more units than purveyors of products for the home over BFCM, the individual units sold in Home come at a higher average price point. In other words, it takes a smaller volume of units to have a more significant impact on overall market share.
Not judging, just saying.
We see a similar trend in other consumer packaged goods and wellness categories like Hair Care, Personal, Skincare, Food, Drinks and Beverages, as well as Supplements and Vitamins. And that’s not very surprising. Furniture, rugs, etc. cost a lot more than a tin of pickled fish. But even an incremental increase in price per product can have a big impact when we’re dealing in quantity.
Market Share: Apparel Emerges as Clear Leader. Home and Beauty can come too.
So, let’s take a closer look at said market share. We’ll start with the two weeks before the BFCM event.
If we break it down to the proportion of overall revenue by categories (note that we are rolling up anything that captures less than 3% of the market for ease of interpretation) there are some clear winners. Once again Apparel stands out as far and beyond the most popular category of the moment, though both Beauty and Home capture more than enough of the overall revenue to get noticed.
Accessories, a category that includes products like bags, purses, wallets, sunglasses, jewelry, and more, captures another 12%, and then Haircare comes out of left field with a pretty impressive 5% of the market. Are we really spending that much on shampoo?
(I know I am, but that is a relatively interesting story for another day.)

So this brings up a few questions. First of all, does this particular breakdown of Category Market Share stay true through BCFM? Or are we buying entirely different stuff for the shopping holiday? Anecdotally speaking, we might assume that many shoppers are saving their high-cost wishlist items for when they can get the deepest discounts possible. I know that’s my plan at least.
The answer is, quite unsatisfyingly, no. 🤪
At first glance, it would seem we’re buying pretty much the same stuff we always do on Black Friday, or at least the same type of stuff, just in larger quantities. More on this when we dig deeper into pricing.

There are a few minor shifts from the two weeks prior: smaller categories that drop below the cut-off, slight changes in overall share for our top categories like Home (+1%), Beauty (-2%), and Accessories (-3%), but nothing outside your standard margin of error. Turns out we’re basic!
But right now, the same could be said for this analysis. Because, as we know, the average cost of goods sold within a category has a significant impact on market share as measured by total revenue. So where this really starts to get interesting, is when we start to break down market share by price range:

Once again, Apparel dominates in both the $50 to $100 range with a 28% share of the market, and even more so at the $100 to $500 range, where sales in the category make up a gobsmacking 59% of the total estimated sales revenue.
That means if you’re taking Nik Sharma’s great advice and looking for an AOV above $150, Apparel is 100% the category for you.
Our lowest ranges, under $20, and then up to $50, are both relatively diverse with Beauty stepping up to lead the pack, and personal care products taking another significant slice. It makes sense, right? Make-up products, body wash, shampoo, and all the other miscellaneous potions and lotions one wields to fend off old age, tend to fall within these ranges. (Don’t worry, some are more expensive than others, which is why Beauty snags 6% of the market in $100-500.)
Also notable is Activities and Outdoor breaking out in the highest price range. This is likely because the category contains some pretty high-end items (good gear is not cheap my friends), and while the category overall sees relatively low units sold, this indicates that each sale does bring in a good chunk of revenue and that the category has untapped potential for rapid growth. The seasonal aspect may also be having an impact here, not too many of us are considering camping in December.
Home appears with a significant share across every price range, reflecting the wide variety of products available in the category, from candles to couches.
And last but not least, it’s telling that Baby and Kids only makes a top-ranking appearance in either the under $20, or $500+ ranges. It’s either cheap shampoo-conditioner-body-wash-in-one or a $2000 stroller as the torture of Millennial parents marches on.
The Golden Rule of Pricing to Quantity Sold
Ok, so let’s talk more about this relationship between the number of products sold, and how much those products cost.
In the two weeks before the BFCM, this is what that looked like (in song form! JK, how about a scatterplot?):

Again we see our top-ranking categories break out from the pack: Apparel, Home, Accessories, and Beauty all see a high number of units sold, and priced well to capture revenue. (Actually, Tech is more pricey than Beauty but only like three-and-a-half nerds bought anything so we’re going to ignore that for now.)
During BFCM, the chart looks pretty similar, though Home and Accessories are both up, but sort of switch spots when it comes to price versus units sold. Accessories see a bigger jump in average price than Home, but the latter sees a bigger increase in units sold. Discounts on Beauty products impact pricing overall but only slightly and Apparel remains an outlier across categories.
But while these two charts appear pretty similar over the two time periods, it’s the overall scale that will blow your mind. Total units sold (which you’ll find along the x-axis) pretty much double during BFCM.
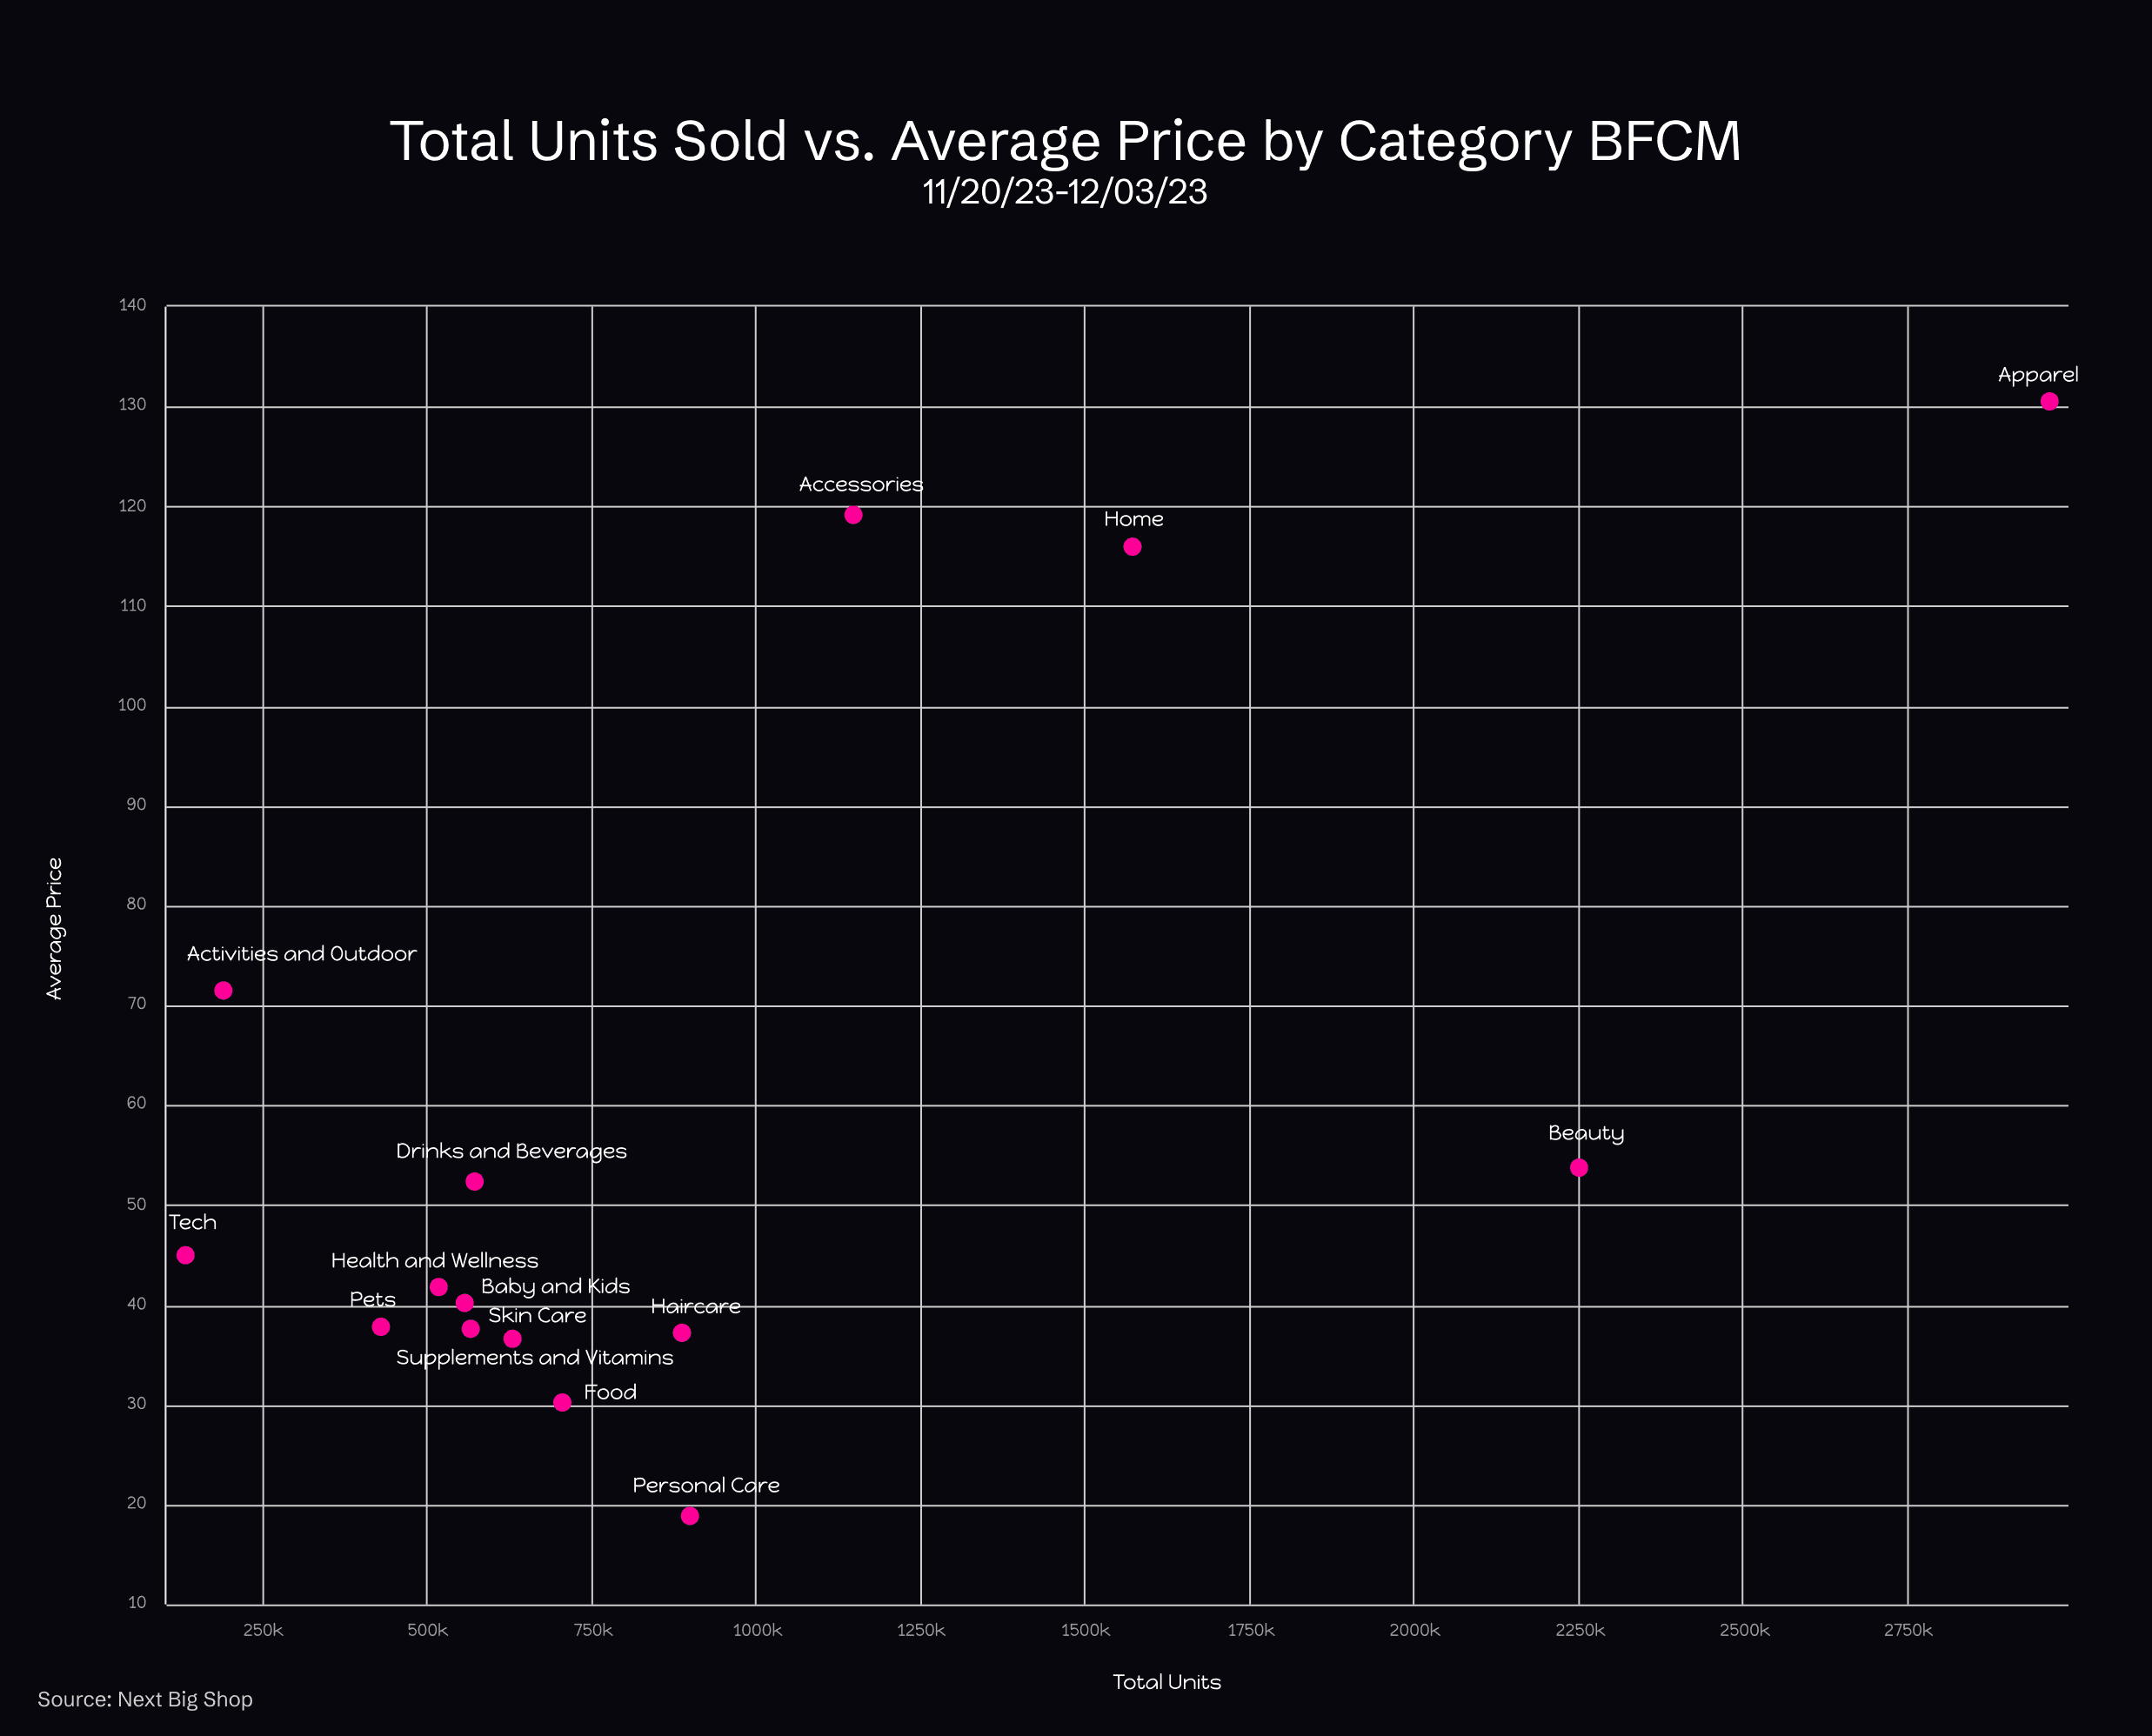
Beauty stands out as an interesting category here, given a relatively low average price point compared to the other top categories, and seems poised for revenue growth. I know I could be convinced to pay more if I had to. (Also they don’t sell Botox on Shopify AFAIK. Yet. #marketopportunity?)
Everybody Gets a Car from BFCM 👏
Ok, so we know the scale of units sold has exploded for BFCM. And that’s pretty much true across the board for categories.

Baby and Kids is up almost 4x. Drinks and Beverages, as well as Skincare have close to tripled their units sold. In fact, 12 out of the 15 categories tracked by Next Big Shop have more than doubled in sales volume. If ever you needed evidence that shoppers are suckers for a good sale, here it is.
The only category where the lift wasn’t quite as large as one might expect is Accessories, and even here we saw units sold jump 1.5x from the two weeks prior. Still, as a top-ranking brand category, we might expect that change to look more similar to that of Apparel, Beauty, and Home (i.e. more than 2x).

But we all knew we were going to shop more for BCFM. But that’s because we’re after the discounts, right? Well here’s the graph that will really rock your socks off (sidenote, socks as a product also did well in this time period, just ask Feetures):

Everything got more expensive! 😳
Let me explain why. You might expect to see the average price of goods sold to go down for BFCM, given the steep discounts and overall it’s-basically-free vibe we’ve been sold by expert marketers around the world. And brands are indeed discounting their inventory deeply (trust me, I have a steep credit card bill full of indulgences I couldn’t resist to prove it).
However, remember my grand plan to save all my high-priced wishlist items for Black Friday?
Well, it turns out I am not alone. So while we are still filling that cart across the same categories at 20-40% off, the products we are buying for BCFM are more expensive than what we usually buy. This brings the overall average price of goods sold up, even with the discounts. (This is kind of like when I realized my mom telling me “We’re saving money by spending money” wasn’t entirely accurate.)
But Which Brands Are So Hot Right Now??
Ok, so that’s enough boring data analysis, let’s move on to the fun stuff: the Brands everyone is buying right now. I will ask you to bear with me for one more second while I explain how we got to these lists.
As we know from this deep dive into BFCM sales and beyond, there are multiple factors that should be taken into account when considering which products, brands, and categories are having the biggest impact on the market overall. So, that’s precisely what we did.
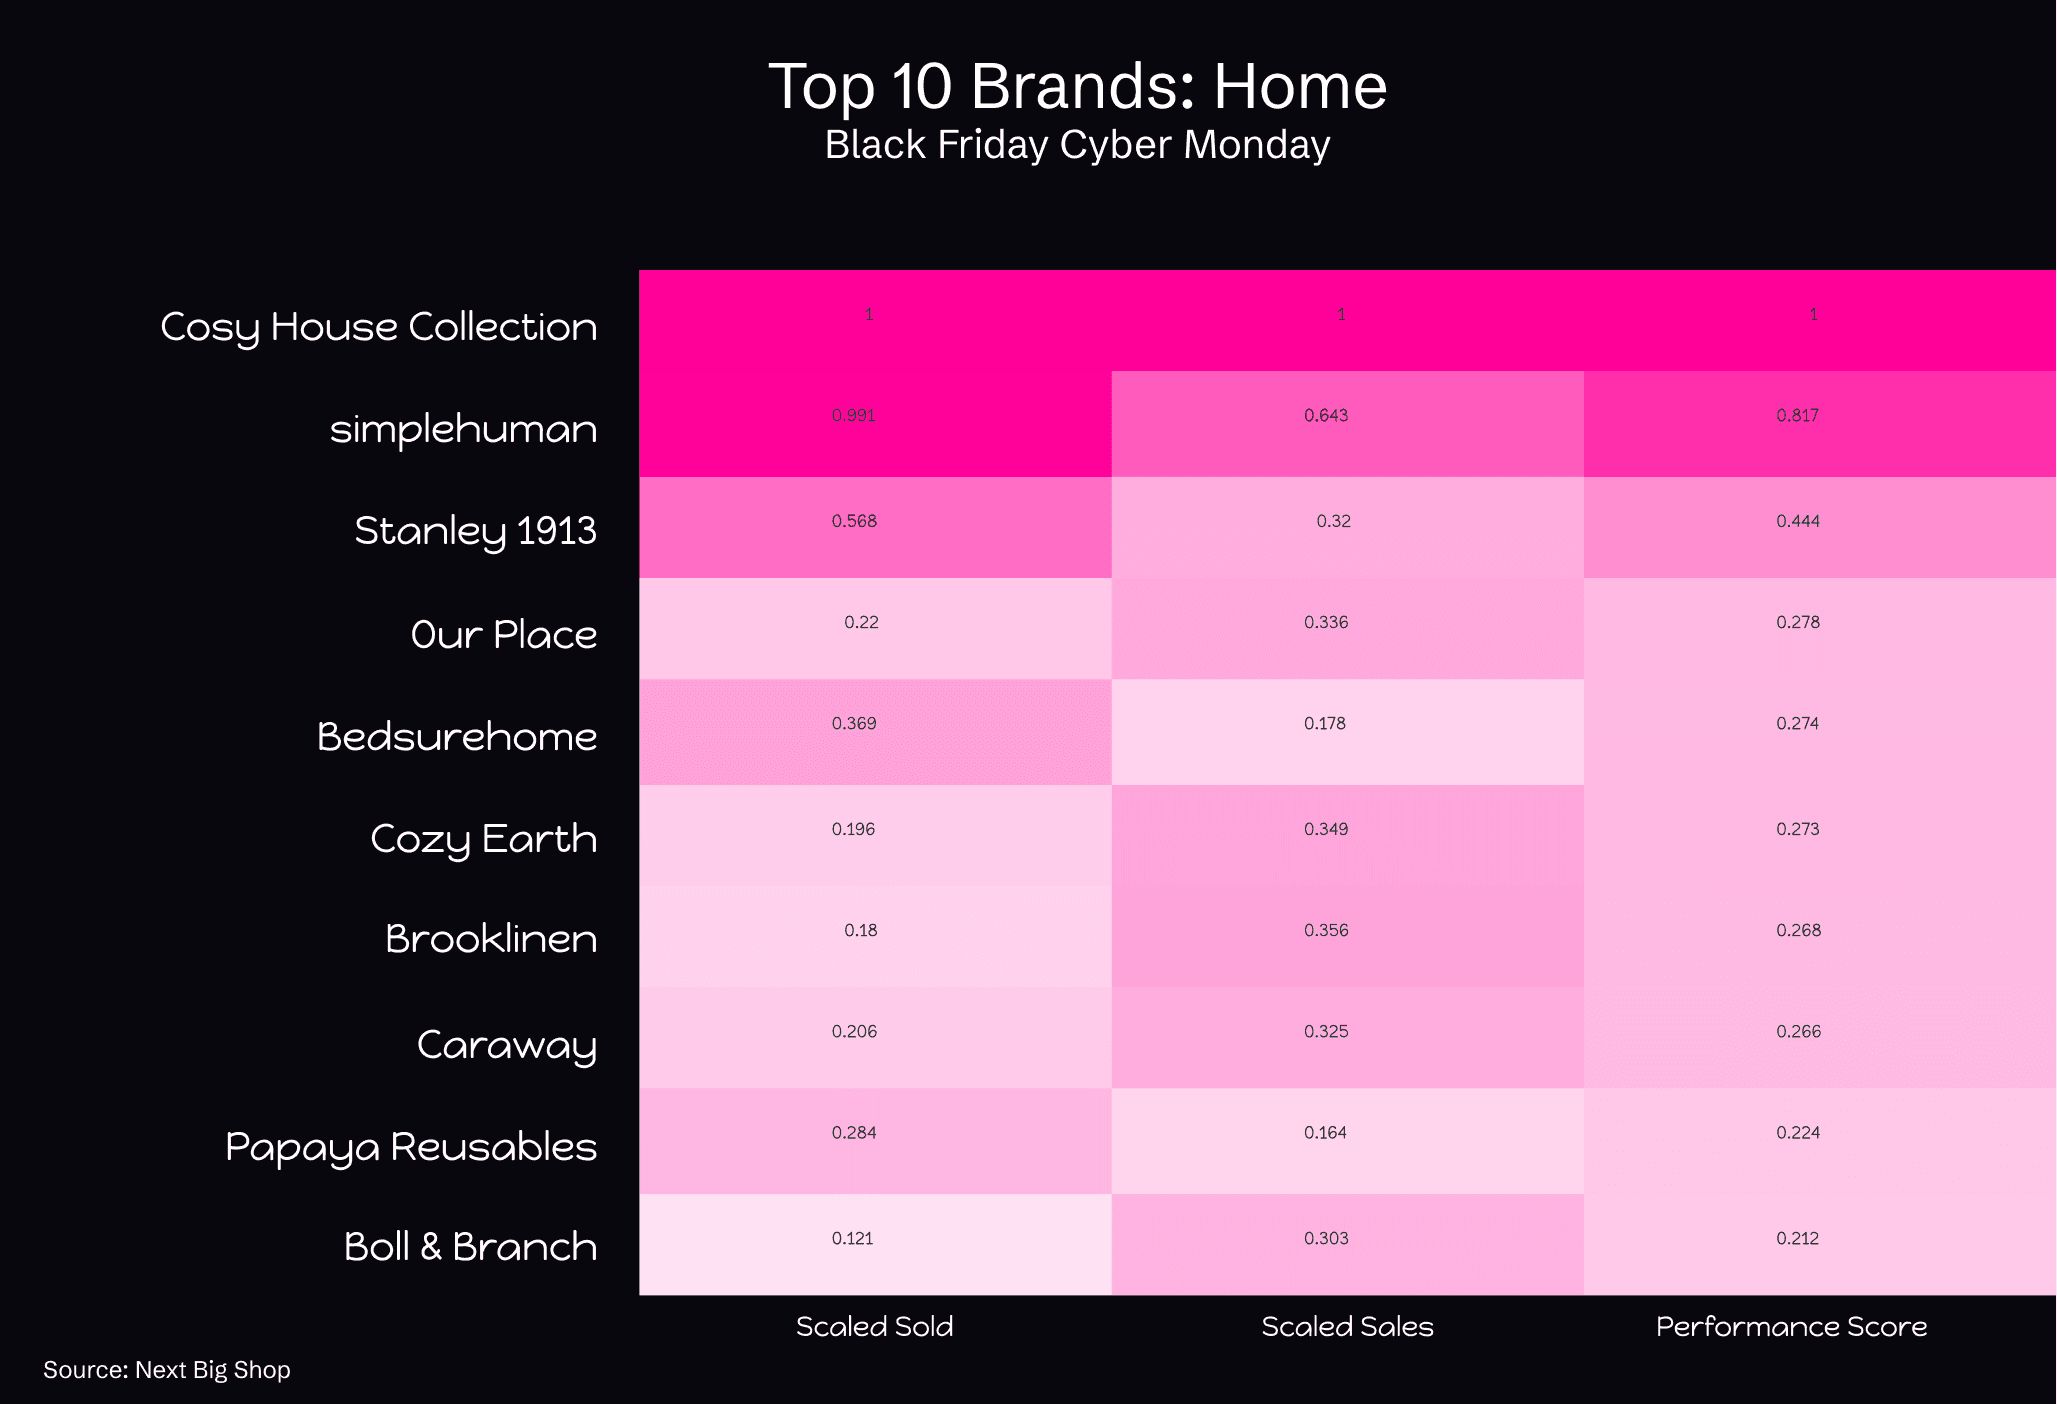
The charts below are based on a weighted average score across the number of units sold, as well as overall sales revenue. We combined these metrics into our performance score and pulled our top ten charts across key categories as well as a few other surprises.
Let’s start with our top ten brands overall.
Remember the brand doing $1Bn+ in annualized revenue? That’s Alo Yoga. Hot on their heels is Kizik (yes it’s a shoe brand and I am proud of that pun), followed by underwear brand Understance, home brand Cosy House Collection, and others:

Next up we have to look at Apparel, right? It is our top category after all.
You’re going to find some repeat customers here at the top, but also a ton of awesome brands that are putting a sustainable approach to fashion front and center. If you’ve been reading my columns you’ll know my obsession with Quince and their superior supply chain probably better than you’d like. Darn Good Yarn makes upcycling a thing of beauty with products like their eco-friendly gift wrap made from reclaimed sari material.
We also see the elevated athleisure trend continue, driving online sales for big brands like Alo and Vuori, as well as sneaker brands like Kizik and Vessi. Also notable is the number of DTC underwear brands that have nabbed a top-ranking slot in Apparel for BFCM. Understance, Tommy John, and Negative Underwear are all bringing undergarments online, emphasizing comfort, fit, and quality first and foremost to capture customers.

Next is our Home Category. Note that Our Place and Caraway are still battling it out in cookware. Stanley Cups continue to be all the rage (does anyone else’s fit in their cupholder?), and now that we’ve all upgraded our own sleep situation for fall, we’re turning to sheet sets for the gifting season as well, with five of the ten top spots in Home going to bedding brands like Cosy House, Bedsure and Brooklinen.
Again we’re seeing brands with the sustainability-first approach succeed with consumers across the board. Simplehuman uses recycled plastics to make trashcans, Papaya Reusables are replacing the paper towel with an eco-friendly alternative, and Boll & Branch uses all organic, fair-trade materials across their product offering.
On to Beauty.
I can’t tell you how excited I am to see Dime topping these charts. Clean and safe skincare should be the goalpost for anything you’re about to put on your face. Thrive Causementics is another vegan cosmetics fan-favorite that puts sustainability front and center. And Lilac St. is bringing lash extensions to the masses with at-home DIY kits, nabbing them not only the second slot in Beauty but a spot on the overall top Brands chart above.

Last, and definitely not least, we’ve got our top ten breakout brands.
These are the brands that earned the highest increase in total units sold compared to the two weeks leading up to BFCM. The majority of these brands are familiar from the charts above, but Yoto, a screenless audio player for your kids, and waterdropⓇ, which is revolutionizing the beverage space, both seem poised to dominate the holiday shopping season.

Don’t believe me? Ask the data:

In sum, we know top athleisure brands are leading the charge in Apparel, not to mention DTC underwear, and that Home remains a strong category with a broad offering across price ranges. For both Accessories and Beauty, we see opportunities for revenue growth. For Accessories, it comes down to driving unit sales; in Beauty, there may be room to adjust and increase pricing.
The purpose-driven approach to brand building continues to resonate with shoppers, which is reflected across top brands no matter the category. However, a brand’s purpose has to make sense, which is why the most successful brands are those able to seamlessly connect supply chain design, thoughtful material choices, and long-lasting quality assurances to their product offering, brand values, and subsequent marketing efforts.
With large gains in revenue over the BFCM holiday season, also known as the Superbowl of e-commerce, it’s safe to say our research underscores that the online shopping industry is thriving at the moment and that while we saw a big lift across the market, some categories were able to capture more of this lift than others.
The End?
Ok, friends, it’s just about time to wrap up this probably longer-than-it-needed-to-be deep-dive on all things BFCM and e-commerce, but before we go I just want to leave you with one final tidbit. If you’ve made it this far I applaud you!
Remember how I mentioned that our market share charts left me with a few open questions? Well, I only answered one.
The other was around all the different categories and brands that could be considered “Wellness.”
These seem to be taking up market share across our charts but aren’t getting the due credit because we’ve broken them out into separate categories by type depending on their niche. And while 15 categories may most accurately represent the diverse needs and habits of consumers, I had a sneaking suspicion that if we rolled these up, things might look a little different.
Of course, because we’re running this analysis across a list of top-selling products by category, simply consolidating isn’t going to give a fair view of the data. Instead, we decided to go back to scratch and group categories like Health and Wellness, Hair-, Skin- and Personal Care into a single Wellness category. Food, Pets, etc. into consumables. Accessories, Outdoor and Activities, Kids and Baby, into Lifestyle (yes, children are a lifestyle choice ergo lifestyle expense thank you very much).
We pulled the top 1000 products across our new categories, and guess what we found?

Wellness IS so hot right now. But Apparel is apparently still hotter. 🤷♀️
Want more insights like these? We'll be back with more stories and data deep-dives from Next Big Shop each week. Follow us on LinkedIn or subscribe to our newsletter below for updates delivered straight to your inbox.
Updates delivered straight to your inbox

